Fine Performance Metrics#
Note
This is an experimental feature and may rapidly change without a deprecation cycle.
You may want to investigate where your Dask workload spends the majority of its time; not only on which tasks, but also doing what while running said tasks. Dask automatically collects fine performance metrics to answer this question by breaking down the end-to-end runtime of a computation by task and, within each task, by a series of activities taken to complete it.
In order to observe these metrics, you can simply
run your workload end-to-end
open the Dask dashboard (default for a LocalCluster: http://localhost:8787)
select
More...->Fine Performance Metrics
Alternatively, if you’re using Jupyter Lab and dask-labextension, you can just drag the
Fine Performance Metrics widget onto your Jupyter dashboard.
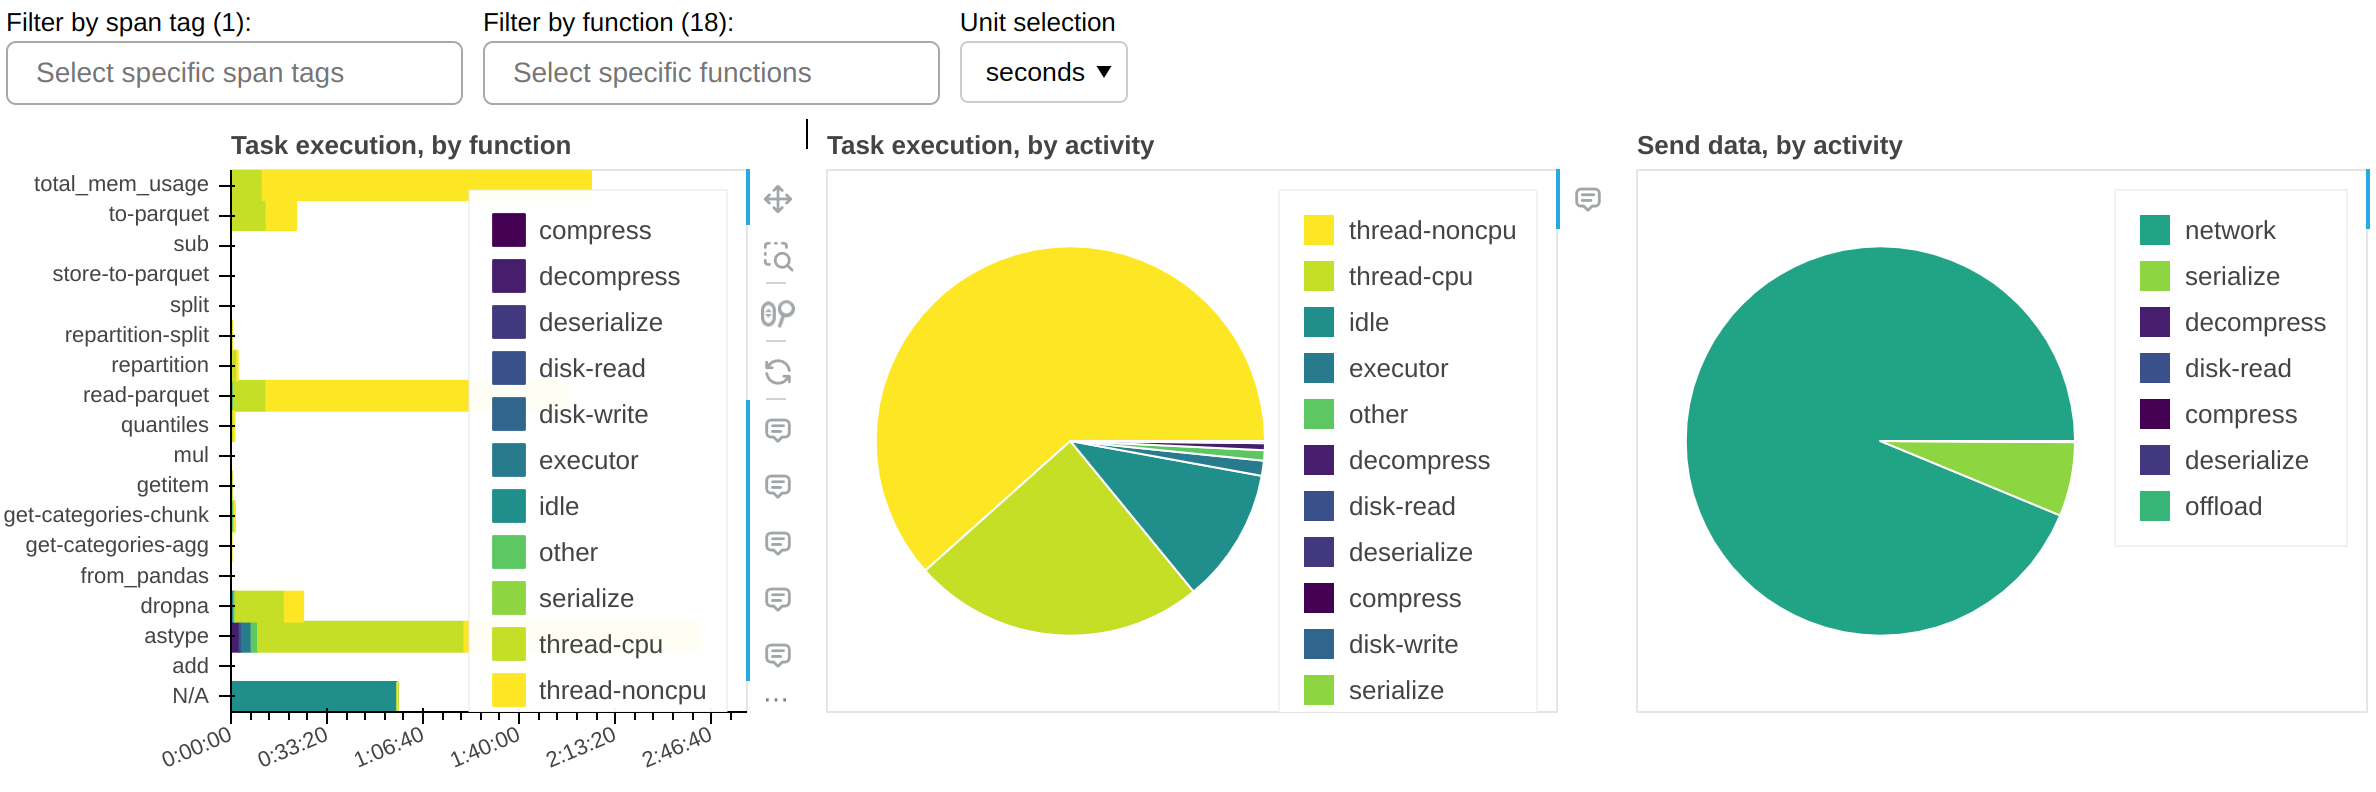
The central panel (Task execution, by activity) shows what activities the cluster spent its time on, cumulatively for all currently-visible functions. The most important ones are:
thread-cpuCPU time spent by tasks while running on workers. This is typically “good” time; in other words it’s the same time you would have spent if you ran the workload serially on a single CPU - but parallelized over however many CPUs are available on your cluster.
thread-noncpuDifference between wall clock time and CPU time spent by tasks while running on workers. This is typically I/O time, GPU time, CPU contention, or GIL contention. If you observe large amounts of this in your overall workload, you probably want to break it down by function and isolate those that are known to perform I/O or GPU activity.
idleTime where a worker had a free thread, but nothing to run on it. This is typically caused by the workload not being able to fully utilize all threads on the cluster, network latency between scheduler and workers, or excessive CPU load on the scheduler. This measure does not include time spent while the whole cluster was completely idle.
disk-read,disk-write,compress,decompressTime spent spilling/unspilling to disk due to not having enough memory available. See Worker Memory Management.
executor,offload,otherThis is overhead from the Dask code and should typically be negligible. However, it can be inflated by GIL contention and by spill/unspill activity.
The grand total of the time shown should roughly add up to the end-to-end runtime of your workload, multiplied by the number of threads on the cluster.
The left panel (Task execution, by function) shows the same information as the central one, but broken down by function.
The right panel (Send data, by activity) shows network transfer time. Note that most
of it should be pipelined with task execution, so it may not have an impact. You should
worry about this only if you have a very large idle time.
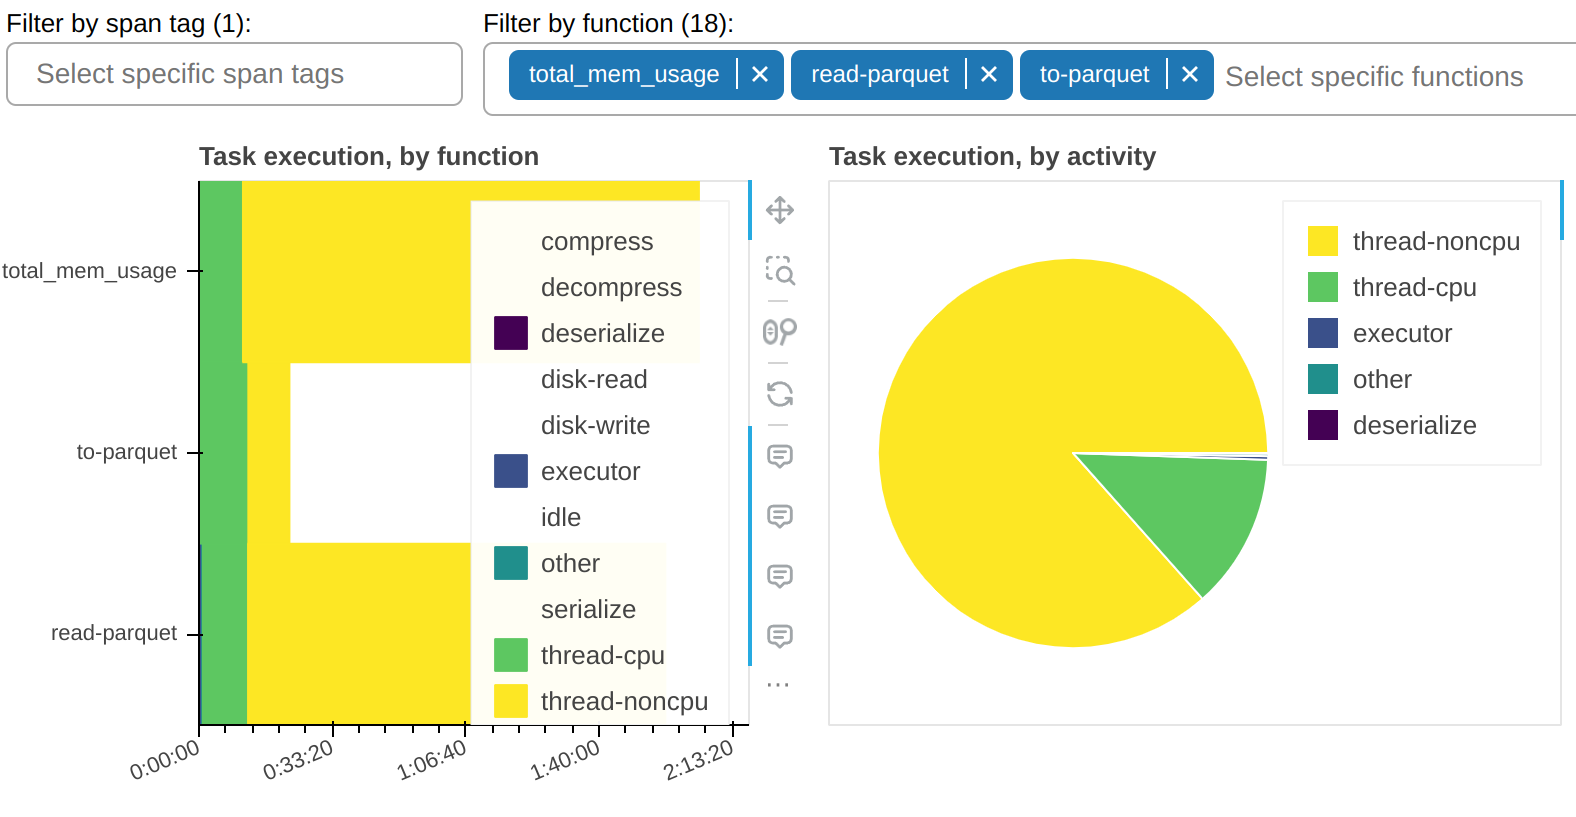
There is a filter that allows you to show only selected functions. In the sample screenshots, you can observe that most of the thread-noncpu time is concentrated - as expected - in functions that are known to be I/O heavy. Here they are singled out:
And here’s all other functions that take a non-trivial amount of time:
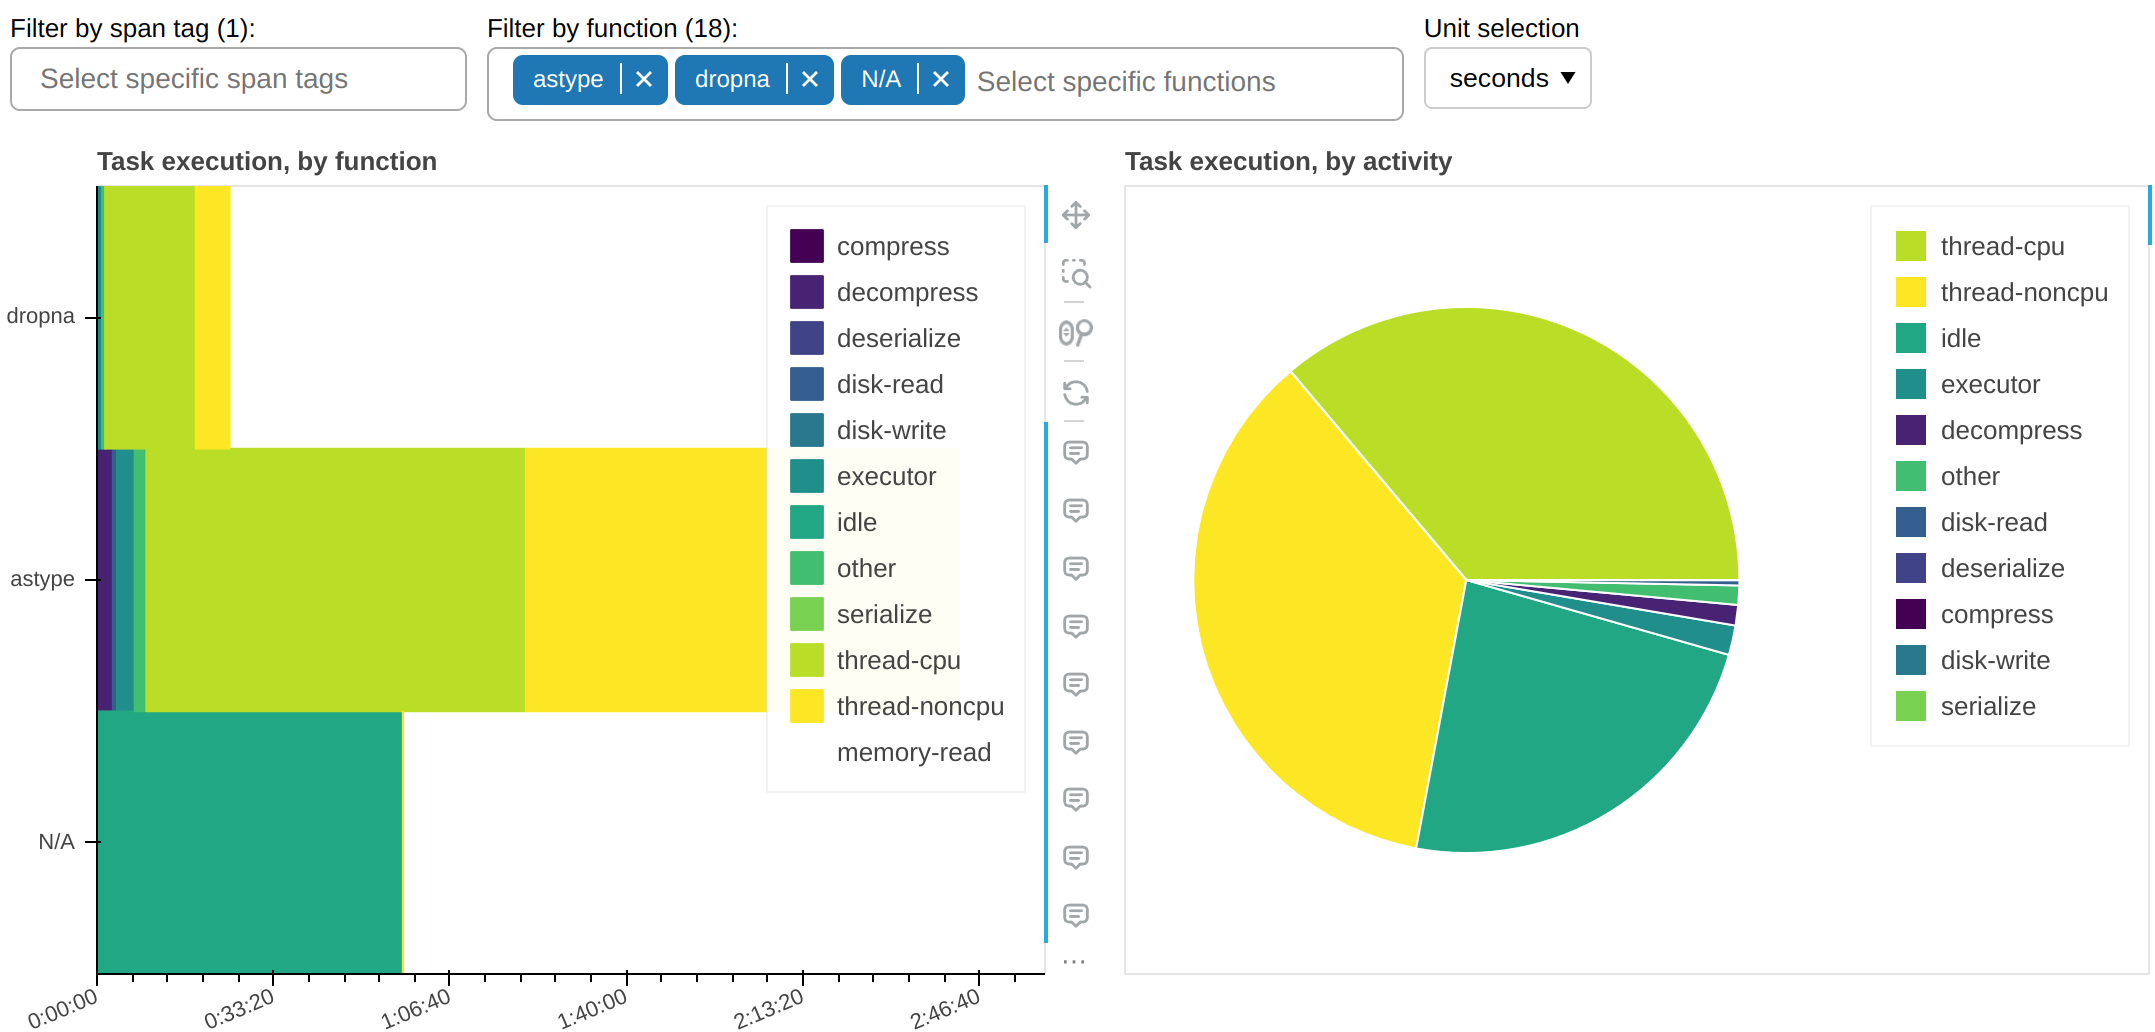
This tells us an important piece of information: why is astype, which is a pure CPU function, spending so much time occupying workers’ threads but without accruing any CPU time? The answer, almost certainly, it’s that it doesn’t properly release the GIL.
Fine Performance Metrics collect more than wall clock timings. We can change the unit to bytes:
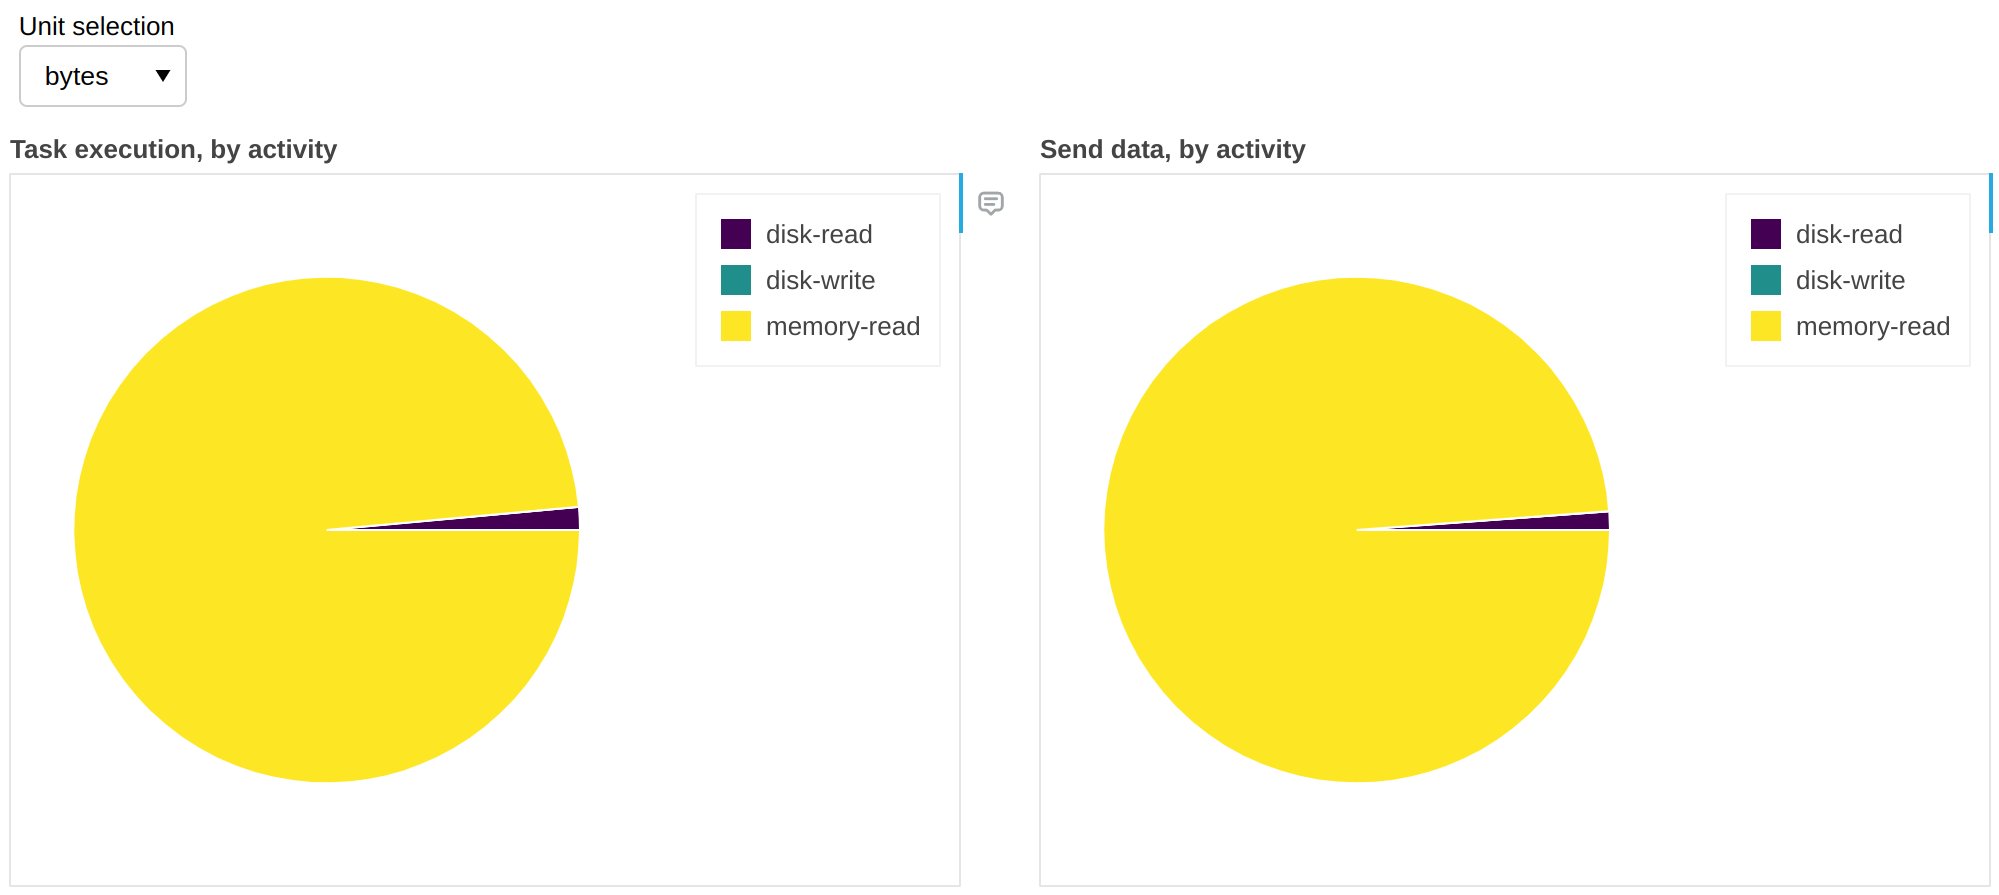
The above gives us insights on spill/unspill activity (see Worker Memory Management). In this workflow, in 99% of the cases there was enough RAM to accommodate all the data and it was unnecessary to retrieve it from disk; in other words we have cache hits for 99% of the data, which means that we would not get any benefit if we increased RAM, but we would likely start seeing slowdowns if we reduced it.
Are task prefixes enough?#
Individual task prefixes may be too granular; vice versa, the same task prefix may appear in very different sections of the workflow. Your codebase may be complex enough that it’s not straightforward to pinpoint the client code that’s responsible for a specific task prefix.
Spans let you break down these metrics into macro-blocks (e.g. data load, preprocessing, etc.).
API for advanced users#
For the most part, fine performance metrics just work; as a user, you don’t need to change your client code.
If you run custom tasks on the cluster (e.g. via submit(),
map_blocks(), or
map_partitions()), you may want to customize the metrics
they produce. For example, you may want to separate I/O time from thread-noncpu:
from distributed.metrics import context_meter

@context_meter.meter("I/O")
def read_some_files():
    ...

future = client.submit(read_some_files)
In the above example, the wall time spent by the custom function read_some_files
will be logged as “I/O”, which is a completely arbitrary activity label.
Alternatively you may want to just label some of the time this way:
def read_some_files():
    with context_meter.meter("I/O"):
        data = read_from_network(...)
    return preprocess(data)
In the above example, the function is split into an I/O intensive phase,
read_from_network, and a CPU-intensive one, preprocess. The
distributed.metrics.context_meter.meter() context manager will log the time spent
by read_from_network as I/O, whereas the time spent by preprocess will still
be logged as a mix of thread-cpu and thread-noncpu (the latter may, for example,
highlight GIL contention).
Note
The distributed.metrics.context_meter.meter() context manager wraps around code
that runs on the worker, in a single task. It won’t work if used to decorate
client-side code that defines the Dask graph. See Spans for that.
Finally, you may want to report a metric that is not just wall time. For example, if you’re reading data from S3 Infrequent Access storage, you may want to keep track of it to understand your spending:
def read_some_files():
    data = read_from_network(...)
    context_meter.digest_metric("S3 Infrequent Access", sizeof(data), "bytes")
    return data
Again, “S3 Infrequent Access” is a completely arbitrary activity label, and “bytes” is a completely arbitrary unit of measure.
- distributed.metrics.context_meter.digest_metric(label: Hashable, value: float, unit: str) None#
Invoke the currently set context callbacks for an arbitrary quantitative metric.
- distributed.metrics.context_meter.meter(label: ~collections.abc.Hashable, unit: str = 'seconds', func: ~collections.abc.Callable[[], float] = <built-in function perf_counter>, floor: float | ~typing.Literal[False] = 0.0) Generator[MeterOutput][source]#
Convenience context manager or decorator which calls func() before and after the wrapped code, calculates the delta, and finally calls
digest_metric().If unit==’seconds’, it also subtracts any other calls to
meter()ordigest_metric()with the same unit performed within the context, so that the total is strictly additive.- Parameters:
- Yields:
MeterOutputwhere thestartattribute is populated straight away,- while
stopanddeltaare nan until context exit. In case of multiple - nested calls to
meter(), then delta (for seconds only) is reduced by the - inner metrics, to a minimum of
floor.
Developer specifications#
Intended audience
This section is only of interest to developers maintaining Dask or writing scheduler extensions, e.g. to create an alternative dashboard or to store metrics long-term.
Fine Performance metrics are collected:
On each worker
On the scheduler, globally
On the Spans
On the workers, they are collected through distributed.core.Server.digest_metric()
and stored in the Worker.digests_total mapping.
They are stored in this format:
("execute", span_id, task_prefix, activity, unit): value("gather-dep", activity, unit): value("get-data", activity, unit): value("memory-monitor", activity, unit): value
At every heartbeat, they are synchronized to the scheduler, where they populate the
Scheduler.cumulative_worker_metrics mapping, in this format:
("execute", task_prefix, activity, unit): value("gather-dep", activity, unit): value("get-data", activity, unit): value("memory-monitor", activity, unit): value
As execute metrics have no span_id here, multiple records from the worker may have
been added up on a single one on the scheduler.
The execute metrics can also be found, disaggregated, on the Spans at
Scheduler.extensions["spans"].spans[span_id].cumulative_worker_metrics, in this
format:
("execute", task_prefix, activity, unit): value
Notes#
In both
Worker.digests_totalandScheduler.cumulative_worker_metrics, you will also find keys unrelated to fine performance metrics, which are not necessarily tuples.Due to custom metrics (see previous section),
activityis going to be most times, but not always, a string.Even barring custom metrics, more fine-grained activities may be added in the future, so it’s never a good idea to implement hardcoded tests for them.